 |
File:Moebius strip.svg is a vector version of this file.
It should be used in place of this raster image when superior.
File:Moebius Surface 1 Display Small.png  File:Moebius strip.svg
For more information about vector graphics, read about Commons transition to SVG.
There is also information about MediaWiki's support of SVG images.
|
|
 Mathematical Function Plot Mathematical Function Plot |
| Description |
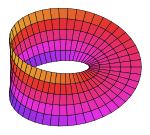
Moebius Strip, 1 half-turn (n=1) |
| Equation |
:
 
|
| Co-ordinate System |
Cartesian ( Parametric Plot) |
| u Range |
0 .. 4π |
| v Range |
0 .. 0.3 |
Mathematica Code
 |
Please be aware that at the time of uploading (15:27, 19 June 2007 (UTC)), this code may take a significant amount of time to execute on a consumer-level computer. |
 |
 |
This uses Chris Hill's antialiasing code to average pixels and produce a less jagged image. The original code can be found here. |
 |
This code requires the following packages:
<
MoebiusStrip[r_:1] =
    Function[
      {u, v, n},
      r {Cos[u] + v Cos[n u/2]Cos[u],
          Sin[u] + v Cos[n u/2]Sin[u],
          v Sin[n u/2],
          {EdgeForm[AbsoluteThickness[4]]}}];

aa[gr_] := Module[{siz, kersiz, ker, dat, as, ave, is, ar},
    is = ImageSize /. Options[gr, ImageSize];
    ar = AspectRatio /. Options[gr, AspectRatio];
    If[! NumberQ[is], is = 288];
    kersiz = 4;
    img = ImportString[ExportString[gr, "PNG", ImageSize -> (
      is kersiz)], "PNG"];
    siz = Reverse@Dimensions[img[[1, 1]]][[{1, 2}]];
    ker = Table[N[1/kersiz^2], {kersiz}, {kersiz}];
    dat = N[img[[1, 1]]];
    as = Dimensions[dat];
    ave = Partition[Transpose[Flatten[ListConvolve[ker, dat[[All, All, #]]]] \
& /@ Range[as[[3]]]], as[] - kersiz + 1];
    ave = Take[ave, Sequence @@ ({1, Dimensions[ave][[#]],
    kersiz} & /@ Range[Length[Dimensions[ave]] - 1])];
    Show[Graphics[Raster[ave, {{0, 0}, siz/kersiz}, {0, 255}, ColorFunction ->
     RGBColor]], PlotRange -> {{0, siz[[1]]/kersiz}, {
  0, siz[]/kersiz}}, ImageSize -> is, AspectRatio -> ar]
    ]

deg = 1;
gr = ParametricPlot3D[Evaluate[MoebiusStrip[][u, v, deg]],
      {u, 0, 4π},
      {v, 0, .3},
      PlotPoints -> {99, 3},
      PlotRange -> {{-1.3, 1.3}, {-1.3, 1.3}, {-0.7, 0.7}},
      Boxed -> False,
      Axes -> False,
      ImageSize -> 220,
      PlotRegion -> {{-0.22, 1.15}, {-0.5, 1.4}},
      DisplayFunction -> Identity
      ];
finalgraphic = aa[gr];

Export["Moebius Surface " <> ToString[deg] <> ".png", finalgraphic]
The following pages on Schools Wikipedia link to this image (list may be incomplete):


 ,
,


