
File:CottonYield.png
Size of this preview: 640 × 384 pixels.
| |
This is a file from the Wikimedia Commons. Information from its description page there is shown below.
Commons is a freely licensed media file repository. You can help. |
Summary
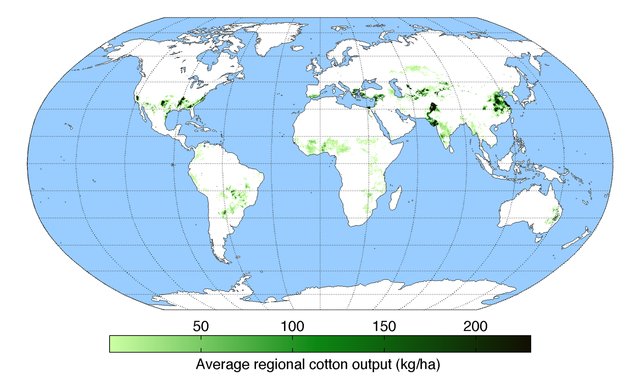
| Description | Map of cotton production (average percentage of land used for its production times average yield in each grid cell) across the world compiled by the University of Minnesota Institute on the Environment with data from: Monfreda, C., N. Ramankutty, and J.A. Foley. 2008. Farming the planet: 2. Geographic distribution of crop areas, yields, physiological types, and net primary production in the year 2000. Global Biogeochemical Cycles 22: GB1022 |
| Date | |
| Source | Own work |
| Author | AndrewMT |
Licensing
|
File usage
The following pages on Schools Wikipedia link to this image (list may be incomplete):
About Schools Wikipedia
Through Schools Wikipedia, SOS Children has brought learning to children around the world. SOS Children believes education is an important part of a child's life. That's why we ensure they receive nursery care as well as high-quality primary and secondary education. When they leave school, we support the children in our care as they progress to vocational training or higher education. Have you heard about child sponsorship? Learn more...