
File:Svalbard temperature.png
| |
This is a file from the Wikimedia Commons. Information from its description page there is shown below.
Commons is a freely licensed media file repository. You can help. |
Summary
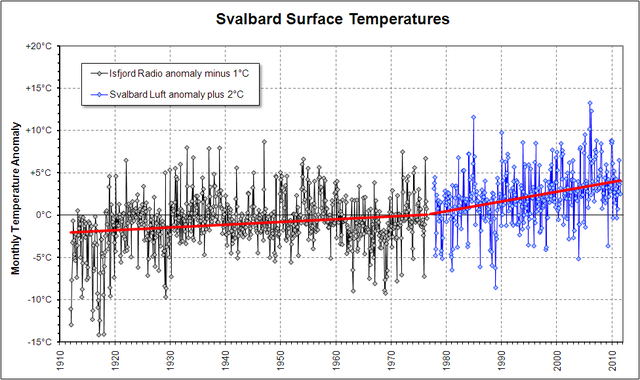
Svalbard surface temperature mean monthly anomalies 1912 to 2011, in °C. Anomalies are station monthly temperatures minus the local average for the month.
The recording station moved some 47 km from Isfjord Radio (78.1°N, 13.6° E) to Svalbard Luft (78.2°N, 15.5°E) in 1976, with little record overlap. There is an obvious station temperature difference, here largely removed by plotting anomalies from monthly averages instead of the raw temperatures.
A common base period for computing anomalies is not available because of the lack of record overlap. The base intervals used here are 1912-1976 for Radio and 1978-2007 for Luft (both near to the local full record). Because of the differing base intervals, the long-term uptrend results in a substantial step change in anomaly (circa 3°C) at the station change. To produce an indicative combined anomaly plot, the difference is here crudely adjusted by moving Radio down by 1°C and Luft up by 2°C, so that the trend lines meet at the station change. The resulting zero crossing is near 1975, so the plotted anomalies relate approximately to the commonly adopted 1960-90 interval.
The Svalbard record shows one of the strongest long-record warming trends on Earth, in close agreement with the pattern of climate model predictions.
Source
Data from NASA GISS Surface Temperature Analysis.
Licensing
|
File usage
I want to learn more...
Wikipedia for Schools brings Wikipedia into the classroom. Thanks to SOS Children, 62,000 children are enjoying a happy childhood, with a healthy, prosperous future ahead of them. Go to http://www.soschildrensvillages.org.uk/sponsor-a-child to sponsor a child.