Topics
- Graphing
- Parabola
- Quadratic Function
- Vertex
Description
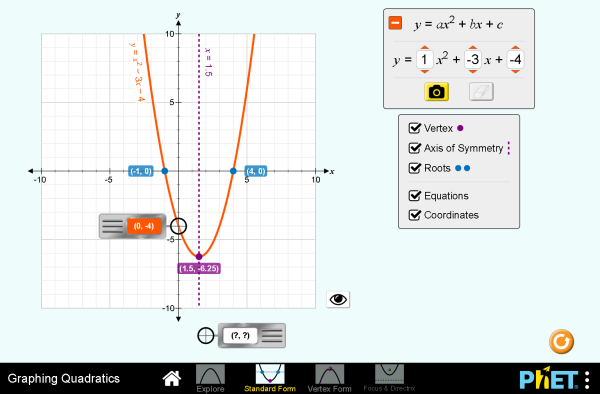
Discover how changing coefficients changes the shape of a curve. View the graphs of individual terms (e.g. y=bx) to see how they add to generate the polynomial curve. Generate definitions for vertex, roots, and axis of symmetry. Compare different forms of a quadratic function. Define a curve by its focus and directrix.
Sample Learning Goals
- Describe how changing the coefficients of a quadratic function changes the graph of the function.
- Predict how the graph of a parabola will change if the coefficients or constant are varied.
- Identify the vertex, axis of symmetry, roots, and directrix for the graph of a quadratic equation.
- Use the vertex form of a quadratic function to describe the graph of the function.
- Describe the relationship between the focus and directrix and resulting parabola.
- Predict the graph of a parabola given a focus and directrix.
Standards Alignment
Common Core - Math
8.F.A.3
Interpret the equation y = mx + b as defining a linear function, whose graph is a straight line; give examples of functions that are not linear. For example, the function A = s2 giving the area of a square as a function of its side length is not linear because its graph contains the points (1,1), (2,4) and (3,9), which are not on a straight line.
HSF-IF.C.7
Graph functions expressed symbolically and show key features of the graph, by hand in simple cases and using technology for more complicated cases.*
HSF-IF.C.7a
Graph linear and quadratic functions and show intercepts, maxima, and minima.
HSF-IF.C.8
Write a function defined by an expression in different but equivalent forms to reveal and explain different properties of the function.
HSF-IF.C.8a
Use the process of factoring and completing the square in a quadratic function to show zeros, extreme values, and symmetry of the graph, and interpret these in terms of a context.
HSG-GPE.A.2
Derive the equation of a parabola given a focus and directrix.
Version 1.1.5