Khan Academy on a Stick
Graphing linear functions
Use the power of algebra to understand and interpret points and lines (something we typically do in geometry). This will include slope and the equation of a line.
-
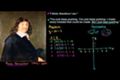 Descartes and Cartesian Coordinates
cc
Descartes and Cartesian Coordinates
ccBridging algebra and geometry. What makes linear equations so linear.
-
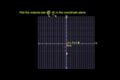
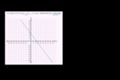
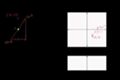
 The Coordinate Plane
cc
The Coordinate Plane
cc -
 Plot ordered pairs
cc
Plot ordered pairs
ccPlot ordered pairs
-
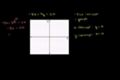
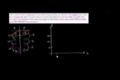
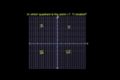 Quadrants of Coordinate Plane
cc
Quadrants of Coordinate Plane
ccQuadrants of Coordinate Plane
Coordinate plane
How can we communicate exactly where something is in two dimensions? Who was this Descartes character? In this tutorial, we cover the basics of the coordinate plane. We then delve into graphing points and determining whether a point is a solution of an equation. This will be a great tutorial experience if you are just starting to ramp up your understanding of graphing or need some fundamental review.
-
 Ordered pair solutions of equations
cc
Ordered pair solutions of equations
ccOrdered pair solutions of equations
-
 Ordered Pair Solutions of Equations 2
Ordered Pair Solutions of Equations
-
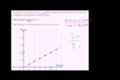
 Plotting (x,y) relationships
cc
Plotting (x,y) relationships
ccPlotting (x,y) relationships
-
 Graphs of Linear Equations
cc
Graphs of Linear Equations
cc -
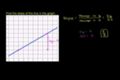
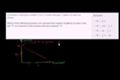
 Application problem with graph
Application problem with graph
-
 Interpreting Linear Graphs
cc
Interpreting Linear Graphs
ccInterpreting Linear Graphs
-
 Exploring linear relationships
cc
Exploring linear relationships
ccExploring linear relationships
-
 Recognizing Linear Functions
cc
Recognizing Linear Functions
ccRecognizing Linear Functions
-
 Graphing lines 1
cc
Graphing lines 1
ccGraphing linear equations
Graphing solutions to equations
In this tutorial, we'll work through examples that show how a line can be viewed as all of coordinates whose x and y values satisfy a linear equation. Likewise, a linear equation can be viewed as describing a relationship between the x and y values on a line.
 Linear and nonlinear functions (example 1)
 Linear and nonlinear functions (example 2)
 Linear and nonlinear functions (example 3)
Linear and nonlinear functions
Not every relationship in the universe can be represented by a line (in fact, most can't be). We call these "nonlinear". In this tutorial, you'll learn to tell the difference between a linear and nonlinear function! Have fun!
-
 Graphing using X and Y intercepts
cc
Graphing using X and Y intercepts
ccGraphing using X and Y intercepts
-
 Graphing Using Intercepts
cc
Graphing Using Intercepts
cc -
 X and Y intercepts
cc
X and Y intercepts
ccX and Y intercepts
-
 X and Y intercepts 2
cc
X and Y intercepts 2
ccX and Y intercepts 2
-
 Finding x intercept of a line
-
 Finding intercepts for a linear function from a table
-
 Interpreting intercepts of linear functions
x-intercepts and y-intercepts of linear functions
There are many ways to graph a line and this tutorial covers one of the simpler ones. Since you only need two points for a line, let's find what value an equation takes on when x = 0 (essentially the y-intercept) and what value it takes on when y = 0 (the x-intercept). Then we can graph the line by going through those two points.
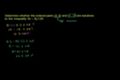
 Rate problem with fractions 1
 Unit cost with fractions 1
 Comparing proportional relationships
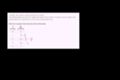 Constructing an equation for a proportional relationship
Proportional relationships and rates of change
In this tutorial we'll think deeper about how one variable changes with respect to another. Pay attention because you'll find that these ideas will keep popping up in your life!
-
 Slope of a line
cc
Slope of a line
ccSlope of a line
-
 Slope of a Line 2
cc
Slope of a Line 2
ccSlope of a Line 2
-
 Slope and Rate of Change
cc
Slope and Rate of Change
cc -
 Graphical Slope of a Line
cc
Graphical Slope of a Line
ccGraphical Slope of a Line
-
 Slope of a Line 3
cc
Slope of a Line 3
ccSlope of a Line 3
-
 Slope Example
cc
Slope Example
ccSlope Example
-
 Hairier Slope of Line
cc
Hairier Slope of Line
ccu13 l2 t1 we int Hairier Slope of Line
-
 Average Rate of Change Example 2)
-
 Average Rate of Change Example 3)
cc
Average Rate of Change Example 3)
cc -
 Algebra: Slope
cc
Algebra: Slope
ccFiguring out the slope of a line
-
 Algebra: Slope 2
cc
Algebra: Slope 2
ccSecond part of determining the slope of a line
-
 Algebra: Slope 3
cc
Algebra: Slope 3
ccPart 3 of slope
Slope
If you've ever struggled to tell someone just how steep something is, you'll find the answer here. In this tutorial, we cover the idea of the slope of a line. We also think about how slope relates to the equation of a line and how you can determine the slope or y-intercept given some clues. This tutorial is appropriate for someone who understands the basics of graphing equations and want to dig a bit deeper. After this tutorial, you will be prepared to start thinking deeper about the equation of a line.
-
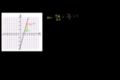
 Graphing a line in slope intercept form
cc
Graphing a line in slope intercept form
ccGraphing a line in slope intercept form
-
 Converting to slope-intercept form
cc
Converting to slope-intercept form
ccConverting to slope-intercept form
-
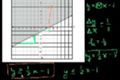
 Fitting a Line to Data
cc
Fitting a Line to Data
cc
Graphing linear equations in slope-intercept form
Math is beautiful because there are so many way to appreciate the same relationship. In this tutorial, we'll use our knowledge of slope to actually graph lines that have been expressed in slope-intercept form.
-
 Comparing linear functions 1
-
 Comparing linear functions 2
-
 Comparing linear functions 3
-
 Interpreting features of linear functions example 2
-
 Comparing linear functions applications 2
-
 Comparing linear functions applications 3
-
 Constructing a linear function word problem
-
 Constructing and interpreting a linear function
Analyzing linear functions
Linear functions show up throughout life (even though you might not realize it). This tutorial will have you thinking much deeper about what a linear function means and various ways to interpret one. Like always, pause the video and try the problem before Sal does. Then test your understanding by practicing the problems at the end of the tutorial.
-
 Multiple examples of constructing linear equations in slope-intercept form
cc
Multiple examples of constructing linear equations in slope-intercept form
ccLinear Equations in Slope Intercept Form
-
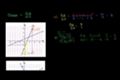
 Constructing equations in slope-intercept form from graphs
cc
Constructing equations in slope-intercept form from graphs
cc -
 Constructing linear equations to solve word problems
cc
Constructing linear equations to solve word problems
ccConstructing linear equations to solve word problems
-
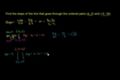
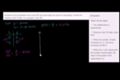
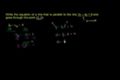
 Linear equation from slope and a point
cc
Linear equation from slope and a point
ccEquation of a line
-
 Finding a linear equation given a point and slope
cc
Finding a linear equation given a point and slope
ccEquation of a line 2
-
 Equation of a line from fractional slope and point
cc
Equation of a line from fractional slope and point
ccu13 l2 t2 we INT Equation of a Line hairier example
-
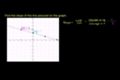
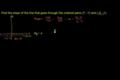
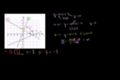
 Constructing the equation of a line given two points
cc
Constructing the equation of a line given two points
ccEquation of a line 3
-
 Finding y intercept given slope and point
Constructing equations in slope-intercept form
You know a bit about slope and intercepts. Now we will develop that know-how even further to construct the equation of a line in slope-intercept form.
-
 Idea behind point slope form
-
 Linear Equations in Point Slope Form
cc
Linear Equations in Point Slope Form
ccLinear Equations in Point Slope Form
-
 Linear Equations in Standard Form
cc
Linear Equations in Standard Form
ccLinear Equations in Standard Form
-
 Point-slope and standard form
cc
Point-slope and standard form
ccPoint-slope and standard form
-
 Converting from point slope to slope intercept form
Point-slope form and standard form
You know the slope of a line and you know that it contains a certain point. Well, in this tutorial, you'll see that you can quickly take this information (and that knowledge the definition of what slope is) to construct the equation of this line in point-slope form! You'll also manipulate between point-slope, slope-intercept and standard form.
-
 Midpoint formula
cc
Midpoint formula
ccMidpoint Formula
-
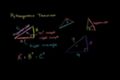 The Pythagorean theorem intro
cc
The Pythagorean theorem intro
ccIntroduction to the Pythagorean Theorem
-
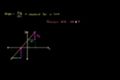
 Distance Formula
cc
Distance Formula
ccHow to find the distance between lines using the Pythagorean Formula
-
 Perpendicular Line Slope
u13 l2 t3 we1 Perpendicular Line Slope
-
 Equations of Parallel and Perpendicular Lines
cc
Equations of Parallel and Perpendicular Lines
ccEquations of Parallel and Perpendicular Lines
-
 Parallel Line Equation
cc
Parallel Line Equation
ccParallel Line Equation
-
 Parallel Lines
cc
Parallel Lines
ccParallel Lines
-
 Parallel Lines 2
cc
Parallel Lines 2
ccParallel Lines 2
-
 Parallel lines 3
cc
Parallel lines 3
ccParallel lines 3
-
 Perpendicular Lines
cc
Perpendicular Lines
ccPerpendicular Lines
-
 Perpendicular lines 2
cc
Perpendicular lines 2
ccPerpendicular lines 2
-
 Distance between a point and a line
-
 Algebra: Equation of a line
cc
Algebra: Equation of a line
ccDetermining the equation of a line
-
 CA Algebra I: Slope and Y-intercept
cc
CA Algebra I: Slope and Y-intercept
cc27-32, figuring out the slope, y-intercept and equation of a line
More analytic geometry
You're familiar with graphing lines, slope and y-intercepts. Now we are going to go further into analytic geometry by thinking about distances between points, midpoints, parallel lines and perpendicular ones. Enjoy!
-
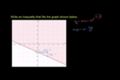
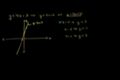 Graphing Inequalities
cc
Graphing Inequalities
ccGraphing Inequalities
-
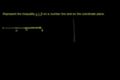 Solving and graphing linear inequalities in two variables 1
cc
Solving and graphing linear inequalities in two variables 1
ccSolving and graphing linear inequalities in two variables
-
 Graphing Linear Inequalities in Two Variables Example 2
cc
Graphing Linear Inequalities in Two Variables Example 2
ccGraphing Linear Inequalities in Two Variables
-
 Graphing Inequalities 2
cc
Graphing Inequalities 2
ccGraphing Inequalities 2
-
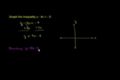
 Graphing linear inequalities in two variables 3
cc
Graphing linear inequalities in two variables 3
ccGraphing linear inequalities in two variables
-
 Graphing Inequalities 1
cc
Graphing Inequalities 1
ccGraphing Inequalities
-
 CA Algebra I: Graphing Inequalities
cc
CA Algebra I: Graphing Inequalities
cc21-26, graphing inequalities and testing assertions
Graphing linear inequalities
In this tutorial we'll see how to graph linear inequalities on the coordinate plane. We'll also learn how to determine if a particular point is a solution of an inequality.
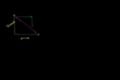
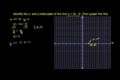
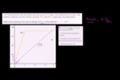
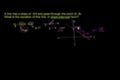
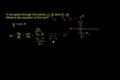
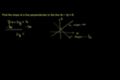
 Similar triangles to prove that the slope is constant for a line
Triangle similarity and constant slope
Use similar triangles to explain why the slope m is the same between any two distinct points on a non-vertical line in the coordinate plane. We'll connect this idea to the equation y = mx for a line through the origin and the equation y = mx + b for a line intercepting the vertical axis at b (cc.8.ee.6).