
Topics
- Polynomials
- Error Analysis
Description
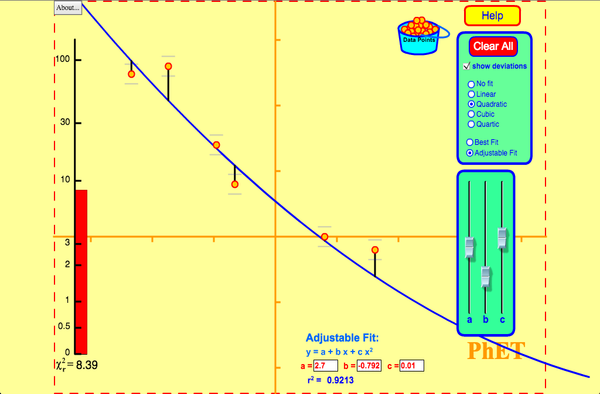
Drag data points and their error bars and watch the best-fit polynomial curve update instantly. You choose the type of fit: linear, quadratic, or cubic. The reduced chi-square statistic shows you when the fit is good. Or you can try to find the best fit by manually adjusting fit parameters.
Sample Learning Goals
- Explain how the range and uncertainty and number of data points affect correlation coefficient and chi squared
- Describe how correlation coefficient and chi squared can be used to indicate how well a curve describes the data relationship
- Apply understanding of Curve Fitting to designing experiments
Standards Alignment
Common Core - Math
HSS-ID.B.6
Represent data on two quantitative variables on a scatter plot, and describe how the variables are related.
HSS-ID.B.6a
Fit a function to the data; use functions fitted to data to solve problems in the context of the data. Use given functions or choose a function suggested by the context. Emphasize linear, quadratic, and exponential models.
HSS-ID.B.6b
Informally assess the fit of a function by plotting and analyzing residuals.
Version 2.02