Topics
- Graphing
- Polynomials
- Curves
Description
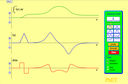
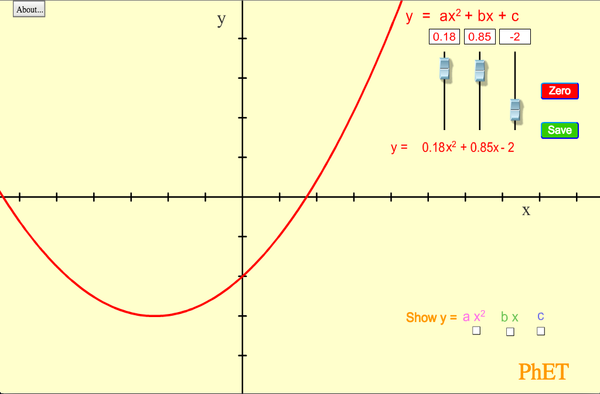
Learn about graphing polynomials. The shape of the curve changes as the constants are adjusted. View the curves for the individual terms (e.g. y=bx ) to see how they add to generate the polynomial curve.
Sample Learning Goals
- Sketch how the graph of a line changes as the coefficient and constant vary.
- Predict how a line graph will look given an equation in other forms.
- Sketch how a parabola changes as coefficients and constant vary.
- Predict how a parabolic graph will look given equations in other forms.
Standards Alignment
Common Core - Math
8.F.A.3
Interpret the equation y = mx + b as defining a linear function, whose graph is a straight line; give examples of functions that are not linear. For example, the function A = s2 giving the area of a square as a function of its side length is not linear because its graph contains the points (1,1), (2,4) and (3,9), which are not on a straight line.
HSF-IF.C.7
Graph functions expressed symbolically and show key features of the graph, by hand in simple cases and using technology for more complicated cases.*
Version 2.02