Topics
- Graphing Linear Equations
- Lines
- Slope
Description
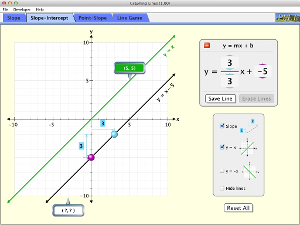
Explore the world of lines. Investigate the relationships between linear equations, slope, and graphs of lines. Challenge yourself in the line game!
Sample Learning Goals
- Explain how the slope of a graphed line can be computed.
- Graph a line given an equation in either slope-intercept or point-slope form.
- Write an equation in slope-intercept or point-slope form given a graphed line.
- Predict how changing variables in a linear equation will affect the graphed line.
Standards Alignment
Common Core - Math
8.EE.B.5
Graph proportional relationships, interpreting the unit rate as the slope of the graph. Compare two different proportional relationships represented in different ways. For example, compare a distance-time graph to a distance-time equation to determine which of two moving objects has greater speed.
8.EE.B.6
Use similar triangles to explain why the slope m is the same between any two distinct points on a non-vertical line in the coordinate plane; derive the equation y = mx for a line through the origin and the equation y = mx + b for a line intercepting the vertical axis at b.
HSF-IF.C.7
Graph functions expressed symbolically and show key features of the graph, by hand in simple cases and using technology for more complicated cases.*
HSF-IF.C.7a
Graph linear and quadratic functions and show intercepts, maxima, and minima.
HSF-LE.A.1a
Prove that linear functions grow by equal differences over equal intervals, and that exponential functions grow by equal factors over equal intervals.
Version 1.00